GBP/USD Forecast: Pound Sterling ignores overbought conditions after UK data
- GBP/USD trades at its highest level since early October above 1.3200.
- The ILO Unemployment Rate in the UK held steady at 4.4% in the three months to February.
- The pair's near-term technical outlook shows that conditions remain overbought.
GBP/USD preserves its bullish momentum after posting gains for five consecutive days and trades at a fresh 2025-high near 1.3250 on Tuesday. The pair's technical picture points to overbought conditions.
British Pound PRICE Last 7 days
The table below shows the percentage change of British Pound (GBP) against listed major currencies last 7 days. British Pound was the strongest against the US Dollar.
USD EUR GBP JPY CAD AUD NZD CHF USD -3.83% -3.87% -3.40% -2.72% -5.71% -6.32% -5.27% EUR 3.83% -0.10% 0.42% 1.13% -1.96% -2.55% -1.51% GBP 3.87% 0.10% 0.53% 1.26% -1.85% -2.46% -1.34% JPY 3.40% -0.42% -0.53% 0.70% -2.37% -3.04% -1.88% CAD 2.72% -1.13% -1.26% -0.70% -3.07% -3.67% -2.55% AUD 5.71% 1.96% 1.85% 2.37% 3.07% -0.61% 0.51% NZD 6.32% 2.55% 2.46% 3.04% 3.67% 0.61% 1.15% CHF 5.27% 1.51% 1.34% 1.88% 2.55% -0.51% -1.15%The heat map shows percentage changes of major currencies against each other. The base currency is picked from the left column, while the quote currency is picked from the top row. For example, if you pick the British Pound from the left column and move along the horizontal line to the US Dollar, the percentage change displayed in the box will represent GBP (base)/USD (quote).
Pound Sterling gathered strength on Tuesday following the UK employment data. In the three months to February, the ILO Unemployment Rate held steady at 4.4%, the Office for National Statistics (ONS) reported. Further details of the publication showed that job vacancies fell below their pre-pandemic levels for the first time in nearly four years.
In the meantime, the improving risk mood further supports GBP/USD in the European session on Tuesday. At the time of press, US stock index futures were rising between 0.2% and 0.3%, while the UK's FTSE 100 Index was up about 1% on the day.
In the second half of the day, the US economic calendar will feature Import Price Index and Export Price Index data for March. Additionally, the Federal Reserve Bank of New York will publish the Empire State Manufacturing Survey for April.
In case risk flows continue to dominate the action in financial markets in the second half of the day, GBP/USD could hold its ground. On the flip side, a rebound in the US Dollar on stronger-than-forecast data releases could open the door for a downward correction in the pair.
GBP/USD Technical Analysis

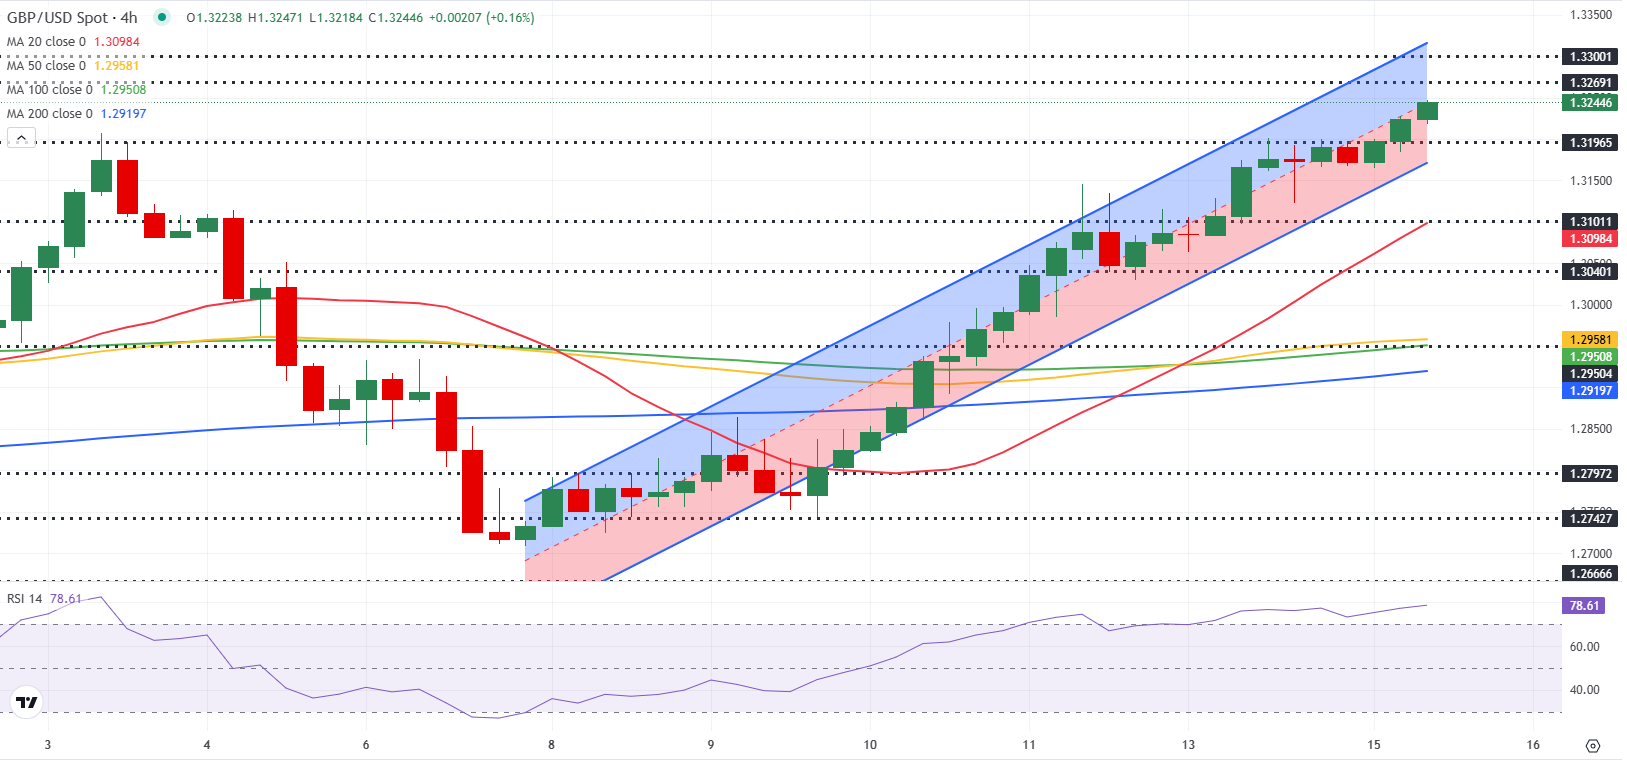
GBP/USD remains within the ascending regression channel but the Relative Strength Index (RSI) indicator on the 4-hour chart continues to edge higher in the overbought territory above 70, suggesting that GBP/USD could stage a technical correction before the next leg higher.
GBP/USD faces immediate resistance at 1.3250 (mid-point of the ascending channel). In case the pair confirms that level as support, 1.3300 (round level, static level) could be seen as next resistance before 1.3330 (upper limit of the ascending channel).
On the downside, 1.3200 (static level, round level) could be seen as first support ahead of 1.3170 (lower limit of the ascending channel) and 1.3100 (static level, round level).
Pound Sterling FAQs
🧠 Pro Tip
Skip the extension — just come straight here.
We’ve built a fast, permanent tool you can bookmark and use anytime.
Go To Paywall Unblock ToolSave articles to reading lists
and access them on any device
If you found this app useful,
Please consider supporting us.
Thank you!