EUR/USD Price Forecast: Near-term slides on the table
EUR/USD Current price: 1.1321
- Most markets remain closed amid Labor Day, Wall Street will function normally.
- The US ISM Manufacturing PMI is expected to show a steeper contraction in April.
- EUR/USD battles to regain its positive momentum above 1.1300, could soon test 1.1200.
The EUR/USD pair bottomed at 1.1285 early in the Asian session on Thursday, as the US Dollar (USD) advanced following the release of mixed first-tier data on Wednesday. An economic contraction, as per Gross Domestic Product (GDP) preliminary estimate printing at -0.3% and tepid job creation coupled with softening inflationary pressures.
Wall Street managed to shrug off the dismal growth figure and edged higher, while the USD benefited from receding interest rate hikes concerns. The EUR/USD pair bounced back ahead of the American opening, although action remains limited amid an almost global holiday, as most countries celebrate Labor Day.
Not the United States (US), which has just released Initial Jobless Claims for the week ended April 26. Claims rose by 241K, much worse than the 224K anticipated and the previous weekly figure of 223K. Later in the day, ISM will publish the April Manufacturing Purchasing Managers’ Index (PMI) foreseen at 48, down from the 49 posted in March. Business output contraction is no news, but a worse-than-anticipated reading can dent the market’s mood.
EUR/USD short-term technical outlook
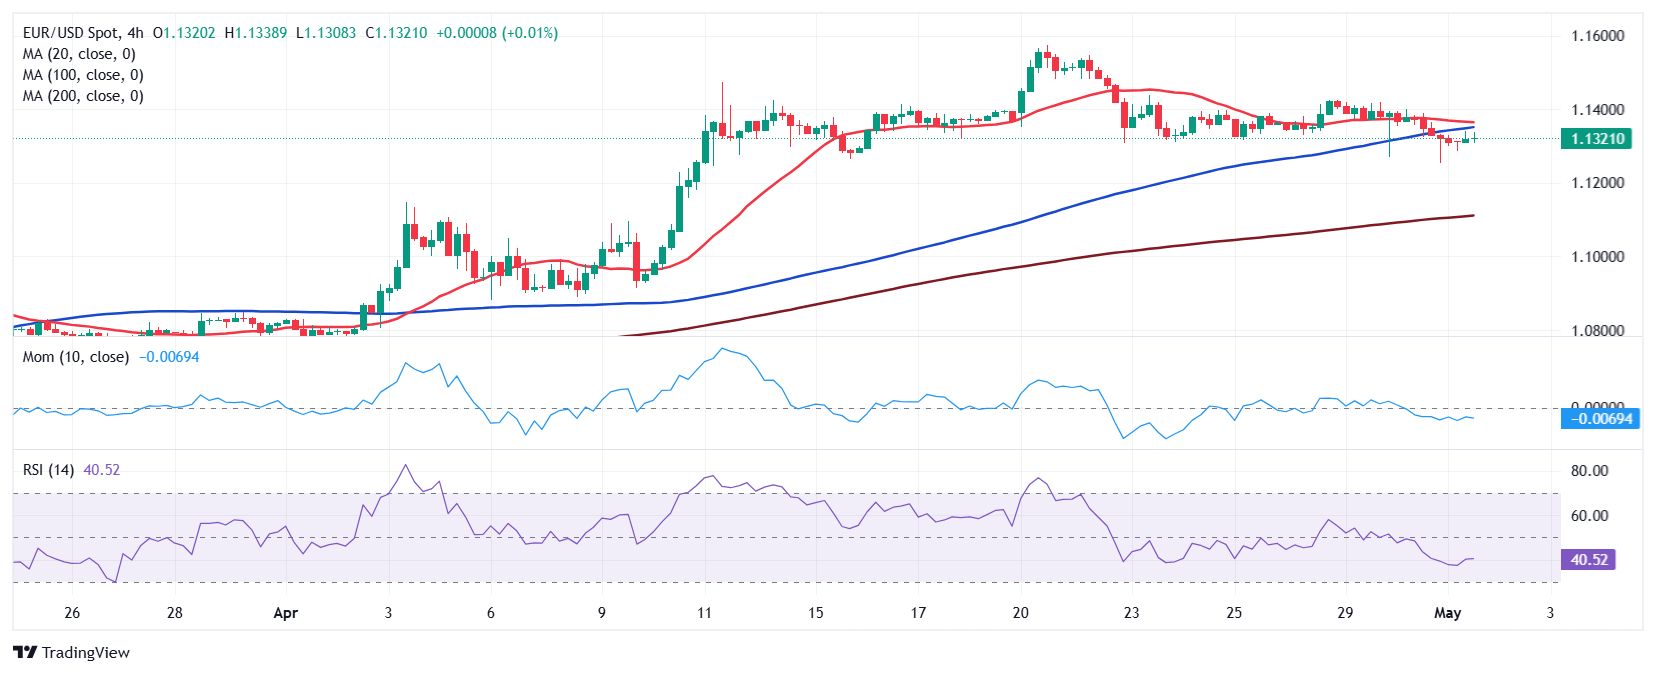
The EUR/USD pair trades in the 1.1320 region, and technical readings in the daily chart show the risk skews to the downside. The pair bottomed near the 20 Simple Moving Average (SMA), which loses its bullish momentum while providing dynamic support at around 1.1275. At the same time, the Momentum indicator heads firmly south and is currently crossing its midline into negative territory, in line with another leg south. Finally, the Relative Strength Index (RSI) indicator heads nowhere at around 57.
The near-term picture is neutral-to-bearish. In the 4-hour chart, EUR/USD is developing below its 20 and 100 SMAs, with the longer one providing resistance around the intraday high of 1.1338. Technical indicators, in the meantime, aim modestly higher within negative levels, suggesting sellers are on pause ahead of fresh clues.
Support levels: 1.1275 1.1230 1.1190
Resistance levels: 1.1340 1.1385 1.1425
Was this article displayed correctly? Not happy with what you see?
If you often open multiple tabs and struggle to keep track of them, Tabs Reminder is the solution you need. Tabs Reminder lets you set reminders for tabs so you can close them and get notified about them later. Never lose track of important tabs again with Tabs Reminder!
Try our Chrome extension today!
Share this article with your
friends and colleagues.
Earn points from views and
referrals who sign up.
Learn more
Save articles to reading lists
and access them on any device